Pos oleh :

admin

Simulation: One of the Methods to Increase Productivity

(Case Study: IKM Matahari Craft)

According to Law and Kelton (1991), simulation method is needed because most real systems in the world are too complex to be evaluated analytically. Simulation method itself is a one of the most widely used technique in operations research and management science. It tries to estimate the characteristics of model by imitate the operations of various kinds of real world processes. Simulation offers several advantages such as, to study the behavior of a system without having to change anything in the real system, results are accurate in general, compared to analytical model, help to find unpredictable phenomenon and easiness to perform “What-If Analysis”.

Its implementation areas are great and varied. For instance, designing and analyzing manufacturing system, assesing hardware and software requirements for a computer system, deciding ordering policies for an inventory system, assesing design for service organizations, evaluate financial or economic systems, etc.

In this article, the author will discuss one of the application of simulation, which is to evaluate design for service organizations, especially in order to increase productivity of the organization. The study take place in one of the SMEs in Yogyakarta named Matahari Craft that makes crafts from corn husk. Matahari Craft itself has a total of 3 workers, where a worker works at the material selection and coloring station, another worker works at the coloring station, drying and lifting. Whereas the other one only works at the final station for stringing corn husk that has been colored before becoming a dried flower product that is ready to sale. As for the flow of the production process owned by Matahari Craft can be seen in Figure 1.

Figure 1. Flow Chart of Matahari Craft Production Process

Before doing the simulation, first the model that will represent the system needs to be built first. In order to do that, it is necessary to collect the processing time data from each workstations. These data will then processed to get processing time distribution of each workstations, which will be used in the simulation. The distribution from the result of processing the time data can be seen in Table 1.

Table 1. Process Time Distribution of Each Workstations

No Data Distribusi
1 Proses pemilahan kulit jagung Weibull (0; 11, 5107; 2, 77097)
2 Proses pewarnaan Empiris
3 Proses penjemuran 2-log-logistic (0; 76.383, 5; 12.697, 8)
4 Proses Perakitan 2-Pearson Type V (0; 2.298, 21; 5, 44037).


After obtaining the process time distribution, the author then simulate the existing condition of Matahari Craft production system to find out whether the workload of each operator is equal or in other case simulation can also be used to see the utilization of the machines. The simulation result shows that the utility of the third operator tends to be lower compared to other two operators. The full result of the simulation can be seen in Table 2. In addition, the production of dried flowers from the existing condition is 360 units.

Table 2. Simulation Result of Existing Condition

In order to make the utility of all operator in the same level and also to increase the production output, the author propose five different scenarios to achieve it, which are: 1) making worker working flexibly (no specific workstation for each workers), 2) the third worker can help the selection material process if there is no other work for him and the first worker is not doing the sorting process, 3) same as scenario two, where the third worker can help the selection material process, but with addition that the first operator gets three additional working hours, 4) increasing the capacity of corn husk storage to 2400 units and also gives three additional working hours for the first and second worker, and 5) same as scenario five, but with addition that the third worker can do the selection process along with the first worker. All those scenarios will be simulated to know which scenario is the best in term of the balance of utility workers and the final product output of the system. Figure 2 will show the comparison of the utility each workers between each scenarios, while Figure 3 will show you the comparison of output from each scenarios.

Figure 2. Comparison of Operator Utility for Each Scenarios


Figure 3. Comparison of Output Value for Each Scenarios

From the five scenarios, the author decided to choose scenario five as the best scenario because even though the workers’ utilities are not even yet the production increases drastically so that it can provide a significant increase in profit.

From this article, can be seen one of the benefits of the simulation, where the author can predicted the outcome from each scenarios without having to make any changes to the real system and decided which scenario is the best one.

Industri Kerajinan Kayu Yogyakarta

Industri Kecil Menengah (IKM) memiliki peran penting untuk membantu perekonomian daerah. Menurut BCIG (2016) , IKM berkontribusi sebesar 99,95% dari jumlah enterprises di Indonesia. Hal ini menunjukkan bahwa IKM memiliki peluang yang cukup besar untuk membantu menggerakkan perekonomian negara dengan produksinya. Akan tetapi pada kenyataannya, produktivitas IKM pada umumnya masih tergolong rendah. Pengendalian produksi dari segi permesinan, jumlah pekerja , penjadwalan kerja , dll , belum dilakukan dengan baik. Sehingga produktivitas yang dicapai belum optimal.

Berdasarkan masalah tersebut, kami bekerja sama dengan salah satu IKM di Yogyakarta untuk melakukan analisis permasalahan yang ada pada IKM mitra dengan memodelkan permasalahan yang ada pada IKM mitra. Model tersebut kemudian akan digunakan untuk menganalisis dan memberikan rekomendasi yang sesuai untuk dapat diterapkan pada IKM mitra dengan harapan rekomendasi yang kami tawarkan dapat diterapkan dan mampu memperbaiki produktivitas dari IKM mitra.

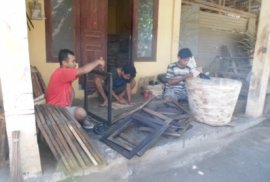
IKM yang dilihat adalah Bangkit Gallery. Bangkit Gallery berdiri sejak tahun 1992 di bidang kerajinan kayu dengan produk unggulan saat ini tempat buah yang terbuat dari akar pohon kayu jati yang dipecah la lu di desain. Selain itu IKM ini juga menerima orderan berbagai macam bentuk kerajinan kayu dari customer. Bapak Sulawi mencari bahan dasar dari  wilayah Gunung Kidul. Kapasitas produksi untuk yang model sederhana berjumlah sekitar 500-700 unit per bulan, sedangkan untuk produksi yang model rumit Bapak Sulawi ini mampu membuat sekitar 200-300 unit per bulan. Bapak Sulawi ini memasarkan secara lokal dan ekspor meliputi Amerika, Australia, Thailand, dan Benua Eropa.

Selanjutnya, dilihat proses dalam pembuatan ukiran kayu. Kemudian didapatkan flowchart pembuatan sebagai berikut:


Sistem tersebut kemudian dianalisis untuk diketahui proses yang mempunyai waktu terlama, dan diketahui dari simulasi yang dilakukan di flexsim jika proses tersebut banyak mengalami bottleneck. Dari hasil analisis dan simulasi maka ditemukan jika proses yang terlama adalah proses pemotongan pola dan proses pemahatan. Untuk memperbaiki permasalahan pada system tersebut maka dilakukan improvement pada system tersebut.

Terdapat 3 simulasi improvement yang dilakukan, yaitu

  1. Skenario 1 yaitu menambah 1 mesin pemotongan dan 1 mesin gergaji
  2. Skenario 2 yaitu menambah 1 mesin pemotongan, 1 mesin gergaji dan 1 mesin pahat
  3. Skenario 3 yaitu menambah 2 mesin pemotongan, 1 mesin gergaji dan 1 mesin pahat.

Dari ketiga scenario tersebut, maka didapatkan bahwa simulasi terbaik yang dapat meningkatkan output produksi IKM Bangkit Gallery dengan optimal adalah solusi ketiga, dimana jumlah outputnya adalah lebih dari 2 kali lipat. Dengan demikian maka dilakukan analisis kelayakan terhadap solusi tersebut, agar solusi yang ditawarkan benar-benar layak dan mampu diterapkan pada IKM tersebut. Didapatkan bahwa B/C ratio untuk analisis tersebut adalah 1,4 yang berarti solusi tersebut feasible untuk dilakukan.

Sehingga didapatkan solusi untuk IKM Bangkit Gallery agar dapat meningkatkan produktivitas dengan cara melakukan penambahan 2 mesin potong, 1 mesin gergaji dan 1 mesin pahat, serta 1 pekerja pada masing-masing proses yang ditambahkan tersebut.

Finding Increased Throughput

How Skarnes, Inc. validated an impactful system change using simulation

A study of an automated storage and retrieval system using FlexSim Simulation Software. A FlexSim model builder created a simulation model of the system to validate the proposed changes to the facility — resulting in improved warehouse efficiency for the end client.

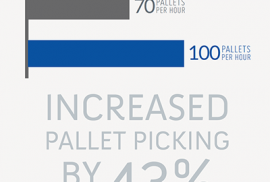
Skarnes Inc., a material handling systems integrator located in Plymouth, MN, wanted to increase the throughput of one of its client’s warehousing processes. The client used an Automated Storage and Retrieval System (AS/RS) that interfaced with a conveyor loop, transporting pallets to a picking station and then back to the AS/RS. This system was capable of picking 70 pallets per hour, and was studied by Skarnes for potential improvements.

Skarnes Model Throughput Results

Issues to Solve

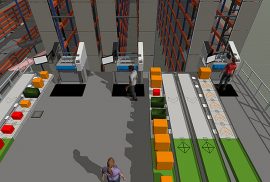
After observing this operation, Skarnes assumed that the number of pallets picked per hour would increase if conveyor congestion could be decreased in front of the AS/RS. Skarnes came up with the idea of adding another mainline conveyor for outbound pallets; this new conveyor would be located above the existing mainline conveyor. To prove the validity of this option to their customer, Skarnes commissioned a computer simulation of the system.

Results

FlexSim developed an accurate 3D simulation model to confirm Skarnes’ proposal. By adding this upper level mainline conveyor, the simulation model showed that the number of pallets picked would rise from 70 to 100 pallets per hour, an increase of 43%. The 3D animation of the system also visually confirmed that conveyor congestion was greatly reduced, adding another level of validation for the client.

Making Critical Warehouse Decisions

How Bastian Solutions found an advantage at an automated warehouse

In large, automated distribution centers, properly organizing and sequencing orders is key to making sure products get out the door on time. With so many interactions and dependencies involved in today’s warehouses, a simulation study is an effective choice to understand and help balance these systems.

For Bastian Solutions, simulation modeling was a critical component in helping their cosmetics distribution client design and implement a highly automated distribution center. The goal was to create a working simulation model of the facility to use as a decision support tool. Bastian Solutions and its talented team of engineers did just that, building a 3D simulation model using FlexSim simulation software.

This model is valuable because it provides immediate and tangible value to the client while adding flexibility for future use. With a working computer model of the facility to experiment on, decision makers can get quick and accurate information to investigate changes in: product slotting, order volumes and order mix, order release parameters (for workload balancing), Warehouse Control System logic, staffing and scheduling plans, and operator productivity.

FlexSim gives modelers the flexibility to customize a model in a variety of ways, so Bastian Solutions equipped it with an intuitive and user-friendly interface. The client doesn’t need any training in using simulation software—Bastian’s custom interface allows them to easily change model inputs and parameters for staffing, order release, capacity, picking rates, and more. The model can be changed, analyzed, and then changed again in a matter of minutes.

Overcoming Challenges

Process Flow in the model

Example of Process Flow logic.

Bastian Solutions overcame several challenges they encountered while modeling such a complex facility. The model needed to manage 40,000 rows of SAP data and associate this data with elements in FlexSim. This is a fair amount of data to manipulate. To solve this problem, Bastian used FlexSim’s integrated SQL functionality to write a number of queries that made the data meaningful and useable in the model.

They also had to discover a way to replicate the logic of their own Warehouse Execution Software (WES), EXACTA, in FlexSim. The WES is the “brain” of the system, sequencing and regulating the release and flow of orders into the facility. FlexSim’s Process Flow tool was used to replicate the WES logic—Bastian Solutions created an algorithm using Process Flow activity blocks to evaluate the system’s capacity against the orders sitting in the pool, and then release the orders in a way that keeps the system balanced. This algorithm is advanced enough to consider order priority and system constraints as it releases and routes containers throughout the facility. It’s also simple to read and follow the algorithm as it works, a feature of Process Flow’s centralized and easy-to-digest logic building.

Bastian Solutions was also able to successfully manage communication between the logic created using Process Flow and the 3D space. The 3D component of the model is critical for dimensioning the facility and its conveyors and also to visually validate what’s going on. Bastian Solutions made extensive use of FlexSim’s “Wait for Event” functionality, which they cited as a powerful frameworkfor communication and data transfer between the model’s logic and its 3D presentation.

Results and Analysis

To help in analyzing and evaluating the model, Bastian Solutions used FlexSim’s built-in dashboards and charting to mimic the four main outputs from their own WES. At the end of a simulation run, the dashboards could help answer the following questions:

  • What is the state of the system right now?
  • What happened throughout the entire picking day?
  • What rates are operators working at, and how much are they utilized?
  • How balanced are the pick areas and pick zones?

The model has been a valuable tool for the client to support decisions made in the facility. Since its custom interface has been set up to quickly change dozens of configurations and inputs, this model will continue to produce for months and even years to come. In future phases of the facility’s lifecycle, the client will even be able to adapt this model to investigate material handling system design changes and expansions, adding even more value from modeling and simulation.

Competitive Advantage in Manufacturing

How Quadrillion Partners transformed a company’s manufacturing flexibility

Smart businesses are on the hunt to continually evaluate and transform how they use their assets. All too often, transformation becomes necessary to maximize resources in response to changing circumstances. In the case of a client of Quadrillion Partners, that change came in the form of a plant closure that forced production volumes to different locations—and threatened increased delivery times to critical customers.

Dallas-based consulting firm Quadrillion helped their client, a global middle market high tech manufacturer, develop a new strategic planning process to make quick, informed decisions when consolidating manufacturing sites or pooling volumes globally. To help with the project, Quadrillion worked with FlexSim to develop a global simulation model that would aid in this critical decision making. The goal? Determine options for pooling product family volumes across different plants globally—balanced against constraints like costs and customer delivery cycle times—to answer questions like:

  • What products should be produced where?
  • What are the costs and benefits of sourcing products from different regions?
  • What bottlenecks or capacity issues can arise?

Managing Complexity

Quadrillion’s client has built a complex and productive global manufacturing ecosystem: six factories producing and shipping more than 75,000 SKUs from over 20 product families. To meet the 600,000 global orders per year, these factories relied on more than 1,000 pieces of equipment, dozens of continuous flow manufacturing lines, and in some cases different product “recipes” for similar products at different locations. This is all before taking into account those all-important customer delivery commitments. For the end client, the FlexSim model needed to imitate every facet of the system to be useful—so that realistic scenarios on volume pooling could be run.

This meant planning a single simulation model that would link orders, customer locations, plants, costs, and current capabilities. Everything from machine speeds to staffing needs to customer logistic routes to the nuances of imports and exports would be considered. Quadrillion gathered and prepared a staggering amount of operational data on the system; this data, contained in 22 spreadsheets, can be updated regularly for future simulations and then quickly pulled in and processed by FlexSim’s robust Excel import capabilities.

The Simulation Solution

The simulation model made extensive use of FlexSim’s Process Flow tool, which allows system characteristics to be modeled with easy-to-use process steps. This method of modeling makes it easier to understand and expand complex models without sacrificing the ability to create a 3D visual representation of the system. It also adds an element of flexibility and responsiveness to data updates when considering different simulation scenarios.

An example of this is when the client wants to evaluate the effects of equipment expansion, a “wish list” item for the simulation model. By adding a number machines to an Excel file, the model logic will automatically update to add the desired number of machines. This allows for rapid scenario evaluation for time-sensitive decision making.

Since customer delivery cycle time was a key metric in this project, the model was fed geo-location data developed by Quadrillion that linked every customer ship-to site with every plant globally by postal code. The geolocation data was then used to calculate average delivery times in days for each product being shipped to each customer globally. This data was a critical excel input for the FlexSim model so that as volumes were pooled, the Quadrillion team could examine the impact on customer delivery times at both the customer order level and in a histogram by product family. The model also showed the trade-off in how quickly products can be delivered to an account versus where that order is made.

Results and Analysis

The simulation model examined a variety of scenarios including volume pooling within regions, options to consolidate plants, and the changes resulting from new labor laws with variable staffing over the course of days. All the critical metrics were present in the model output: order demand by customer and product, capacity in and out of the plant, change over times, cycle times, customer delivery times, etc.

But the model also showed when equipment maxed out in a simulation run (known in manufacturing as a ‘bottleneck’ or congestion or blockage)—something that can only be discovered in a simulation model that considers the variability and interdependencies of real life operations. Once identified in the model, bottlenecks could be resolved with improvements in equipment speed, rebalancing demand across different sites, or replacing pieces of equipment.

Several immediate outcomes of the model were a decision to increase the pooling of volumes across the Asia region, a decision to consolidate from six factories to five, and an initiative to expand lower cost imports into higher cost regions for certain product families.

The existence of a credible cross-functional model that is updated routinely has helped operations and finance make better decisions with a deeper understanding of their manufacturing process. The model is already slated to be expanded in the future, adding more capabilities for faster strategic planning decision making and to consider additional manufacturing challenges.