Written By: Andre Jason
According to Law and Kelton (1991), simulation method is needed because most real systems in the world are too complex to be evaluated analytically. Simulation method itself is a one of the most widely used technique in operations research and management science. It tries to estimate the characteristics of model by imitate the operations of various kinds of real world processes. Simulation offers several advantages such as, to study the behavior of a system without having to change anything in the real system, results are accurate in general, compared to analytical model, help to find unpredictable phenomenon and easiness to perform “What-If Analysis”.
Its implementation areas are great and varied. For instance, designing and analyzing manufacturing system, assesing hardware and software requirements for a computer system, deciding ordering policies for an inventory system, assesing design for service organizations, evaluate financial or economic systems, etc.
In this article, the author will discuss one of the application of simulation, which is to evaluate design for service organizations, especially in order to increase productivity of the organization. The study take place in one of the SMEs in Yogyakarta named Matahari Craft that makes crafts from corn husk. Matahari Craft itself has a total of 3 workers, where a worker works at the material selection and coloring station, another worker works at the coloring station, drying and lifting. Whereas the other one only works at the final station for stringing corn husk that has been colored before becoming a dried flower product that is ready to sale. As for the flow of the production process owned by Matahari Craft can be seen in Figure 1.
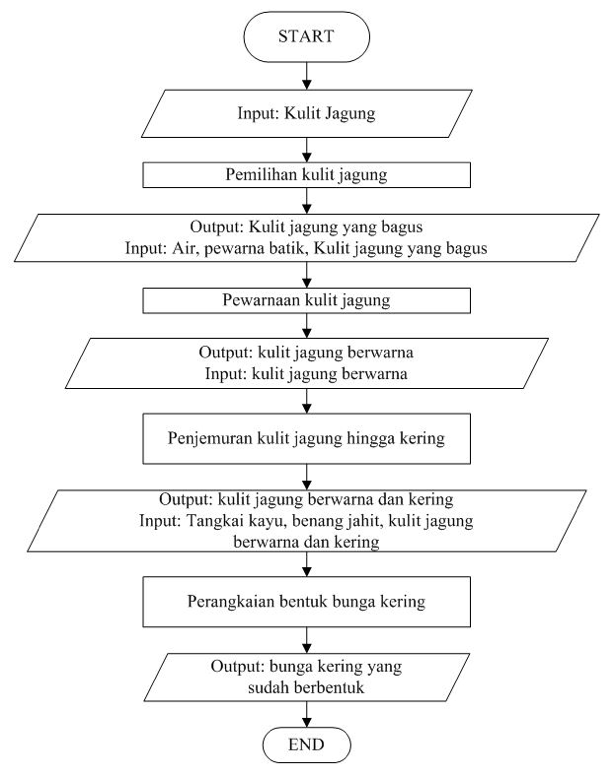
Figure 1. Flow Chart of Matahari Craft Production Process
Before doing the simulation, first the model that will represent the system needs to be built first. In order to do that, it is necessary to collect the processing time data from each workstations. These data will then processed to get processing time distribution of each workstations, which will be used in the simulation. The distribution from the result of processing the time data can be seen in Table 1.
Table 1. Process Time Distribution of Each Workstations
| No | Data | Distribusi |
| 1 | Proses pemilahan kulit jagung | Weibull (0; 11, 5107; 2, 77097) |
| 2 | Proses pewarnaan | Empiris |
| 3 | Proses penjemuran | 2-log-logistic (0; 76.383, 5; 12.697, 8) |
| 4 | Proses Perakitan | 2-Pearson Type V (0; 2.298, 21; 5, 44037). |
After obtaining the process time distribution, the author then simulate the existing condition of Matahari Craft production system to find out whether the workload of each operator is equal or in other case simulation can also be used to see the utilization of the machines. The simulation result shows that the utility of the third operator tends to be lower compared to other two operators. The full result of the simulation can be seen in Table 2. In addition, the production of dried flowers from the existing condition is 360 units.
Table 2. Simulation Result of Existing Condition

In order to make the utility of all operator in the same level and also to increase the production output, the author propose five different scenarios to achieve it, which are: 1) making worker working flexibly (no specific workstation for each workers), 2) the third worker can help the selection material process if there is no other work for him and the first worker is not doing the sorting process, 3) same as scenario two, where the third worker can help the selection material process, but with addition that the first operator gets three additional working hours, 4) increasing the capacity of corn husk storage to 2400 units and also gives three additional working hours for the first and second worker, and 5) same as scenario five, but with addition that the third worker can do the selection process along with the first worker. All those scenarios will be simulated to know which scenario is the best in term of the balance of utility workers and the final product output of the system. Figure 2 will show the comparison of the utility each workers between each scenarios, while Figure 3 will show you the comparison of output from each scenarios.
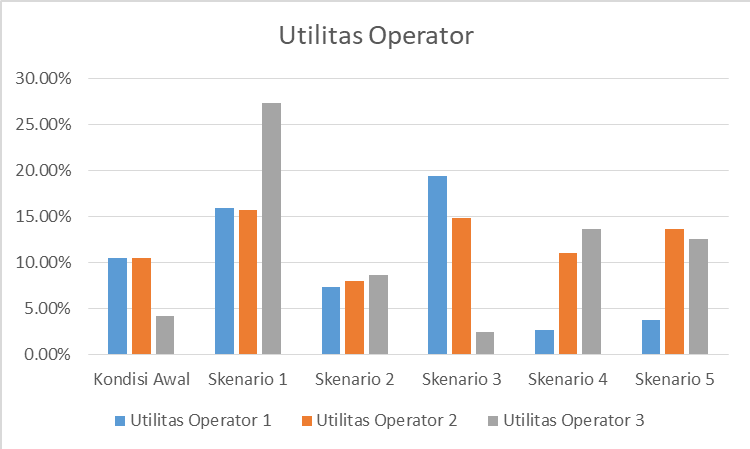
Figure 2. Comparison of Operator Utility for Each Scenarios
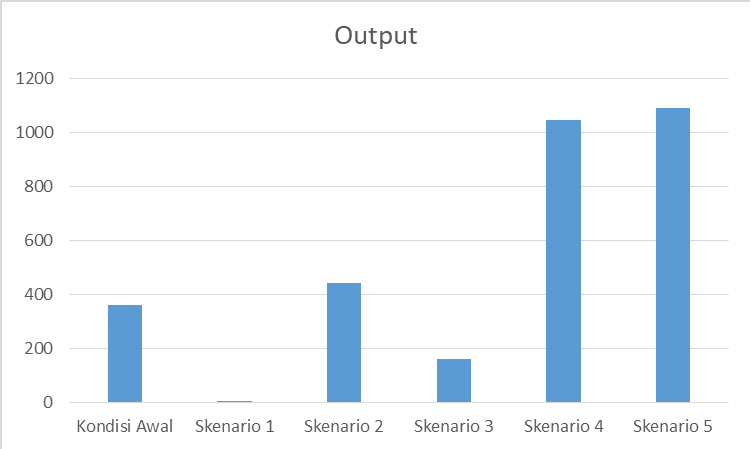
Figure 3. Comparison of Output Value for Each Scenarios
From the five scenarios, the author decided to choose scenario five as the best scenario because even though the workers’ utilities are not even yet the production increases drastically so that it can provide a significant increase in profit.
From this article, can be seen one of the benefits of the simulation, where the author can predicted the outcome from each scenarios without having to make any changes to the real system and decided which scenario is the best one.